Enzyme Primer
Kinetics
When the free energy in the products is less than the free energy of the reactants, the reaction will proceed forward as long as the product concentration is less than the equilibrium concentration.
Reaction velocity
Velocity is defined as the rate of product creation over time. Enzymes decrease the activation energy required for a reaction to occur. Reaction rate will increase until enzymes become saturated (becomes a zero order reaction).
=
k[S] (Ks) = reaction rate
x = reaction order
When reaction order is 0, the reaction rate is independent of substrate concentration.
Michaelis-Menten
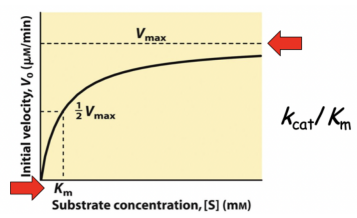
Plots substrate concentration ([S]) against initial reaction velocity (V0). This plot assumes the concentration of the enzymes and substrates remain constant throughout the reaction.
Vmax = maximum velocity
Km = half of the maximum velocity
Note: A higher Km will denote a lower affinity for the substrate (more substrate required to reach 1/2 Vmax)
From this equation, we can find the theoretical maximum catalytic conversion rate per second, or Kcat, which is the maximum velocity (Vmax) divided by the total enzyme concentration (E).
Enzymatic efficiency, therefore, is the maximum catalytic conversion rate (Kcat) divided by the affinity for the substrate (Km).
Lineweaver-Burke
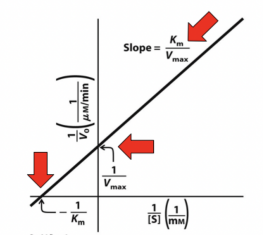
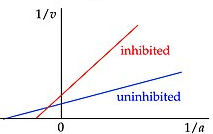
Plots the reciprocal of Michaelis-Menten, or 1/[S] versus 1/V0, linearizing the sigmoidal plot. This allows us to describe different forms of enzymatic activity.
Y-intercept: Inverse of the Vmax
X-intercept: Inverse of the Km
Slope:
Types of enzymatic inhibition
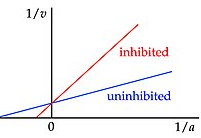
Competitive
In which the inhibitor binds at the enzyme active site. This does not affect the maximum velocity, as the inhibitor can be outcompeted with high enough substrate concentration, but will increase the substrate concentration required to increase velocity (higher Km).
Result: Slope increases
Uncompetitive
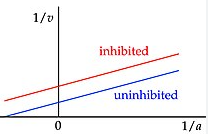
In which the inhibitor binds away from the enzyme active site, changing the overall conformation of the enzyme. This will lower the affinity for the substrate (higher Km) as well as decrease the maximum velocity able to be achieved (lower Vmax).
Result: Positive Y translation
Mixed
In which the inhibitor can bind either at the active site or away from it. This will lower the Vmax, but can increase or decrease the Km.
Result: Negative X translation, slope increases
Enzyme catalytic mechanisms
Proximity and orientation
The enzyme brings substrates into close proximity, improving product formation. This is induced fit, in which the enzyme conformation change improves the reaction rate.
Example: Hexokinase undergoes confirmation change when bound to glucose, decreasing the Km for ATP.
Transition state binding
The enzyme lowers the activation energy of the transition state for a reaction.
Example: An oxyanion hole occurs when oxygen with its negative charges stabilizes the intermediate of the Serine Protease domain.
Acid-Base catalysis
In which a donor acid or base transfers protons with a substrate to enable reaction.
Example: Asp25 on HIV Protease can adopt a base configuration. Protonated aspartic acid will donate protons and then return to its original confirmation.
Covalent catalysis
Forms an intermediate covalent bond between a nucleophile and electrophile, stabilizing them.
Example: Asp52 on lysozyme acts as a nucleophile to form a temporary bond with the substrate.
Metal Ion catalysis
Metal ions will shield negative charges, allowing substrates to be positioned properly. These will also mediate oxidation-reduction reactions.
Example: Mg2+ ions on enolase help orient phosphoglycerate substrates and stabilize negative charges on enolic intermediates.
Cooperativity and regulation
The strength to which a ligand will bind its substrate is determined by its Dissociation Constant (Kd), or the required ligand concentration for which half of ligand binding sites are filled. Therefore, as Kd goes up (more ligands required to bind half), the binding affinity is lower.
When an enzyme has more than one binding site, binding one substrate might affect the binding strength of additional sites.
Positive allosteric regulation: Binding increases the affinity for additional substrates
Negative allosteric regulation: Binding decreases the affinity for additional substrates
Feedback inhibition: A type of negative allosteric regulation, in which enzymatic products reduce the binding affinity for the substrate
Note: Allosteric implies the binding site is not the active site. Allosteric enzymes do not follow Michaelis-Menten.
Hemoglobin
Has 4 subunits which bind oxygen, 2 Alpha and 2 Beta.
R (relaxed) state: High oxygen affinity, does not readily release oxygen
T (tense) state: Low oxygen affinity, readily releases oxygen
Allosteric regulators of hemoglobin
Protons
An increase in pH (more protons) results in an T state. Therefore, high blood acidity like in the case of high metabolic or respiratory demand, will cause hemoglobin to release its oxygen.
The mechanism is that protonation of Histidine in Hemoglobin will stabilize the T-state.
CO2
An increase in CO2 results in a T state. Therefore, as tissues are releasing CO2 like in the case of high metabolic or respiratory demand, hemoglobin will release its oxygen.
The mechanism is that CO2 binding will result in carbamino hemoglobin and more protonation (T state).
2,3 BPG (2,3 Biphosphoglycerate)
Binds more strongly to deoxygenated hemoglobin, stabilizing the T-state. 2,3 BPG is generated in glycolysis and will increase in response to anemia or hypoxia. Therefore, in low oxygen environments (like at altitude), 2,3 BPG will cause hemoglobin to release its oxygen.